![City Hive Logo-2.png]](https://support.cityhive.net/hs-fs/hubfs/City%20Hive%20Logo-2.png?width=62&height=60&name=City%20Hive%20Logo-2.png)
Reporting (POS)
This guide provides a comprehensive overview of the analytics and reporting features available on the platform. We will walk through generating, exporting, and building custom reports to help you gain valuable insights from your data.
1. Key Learning Objectives
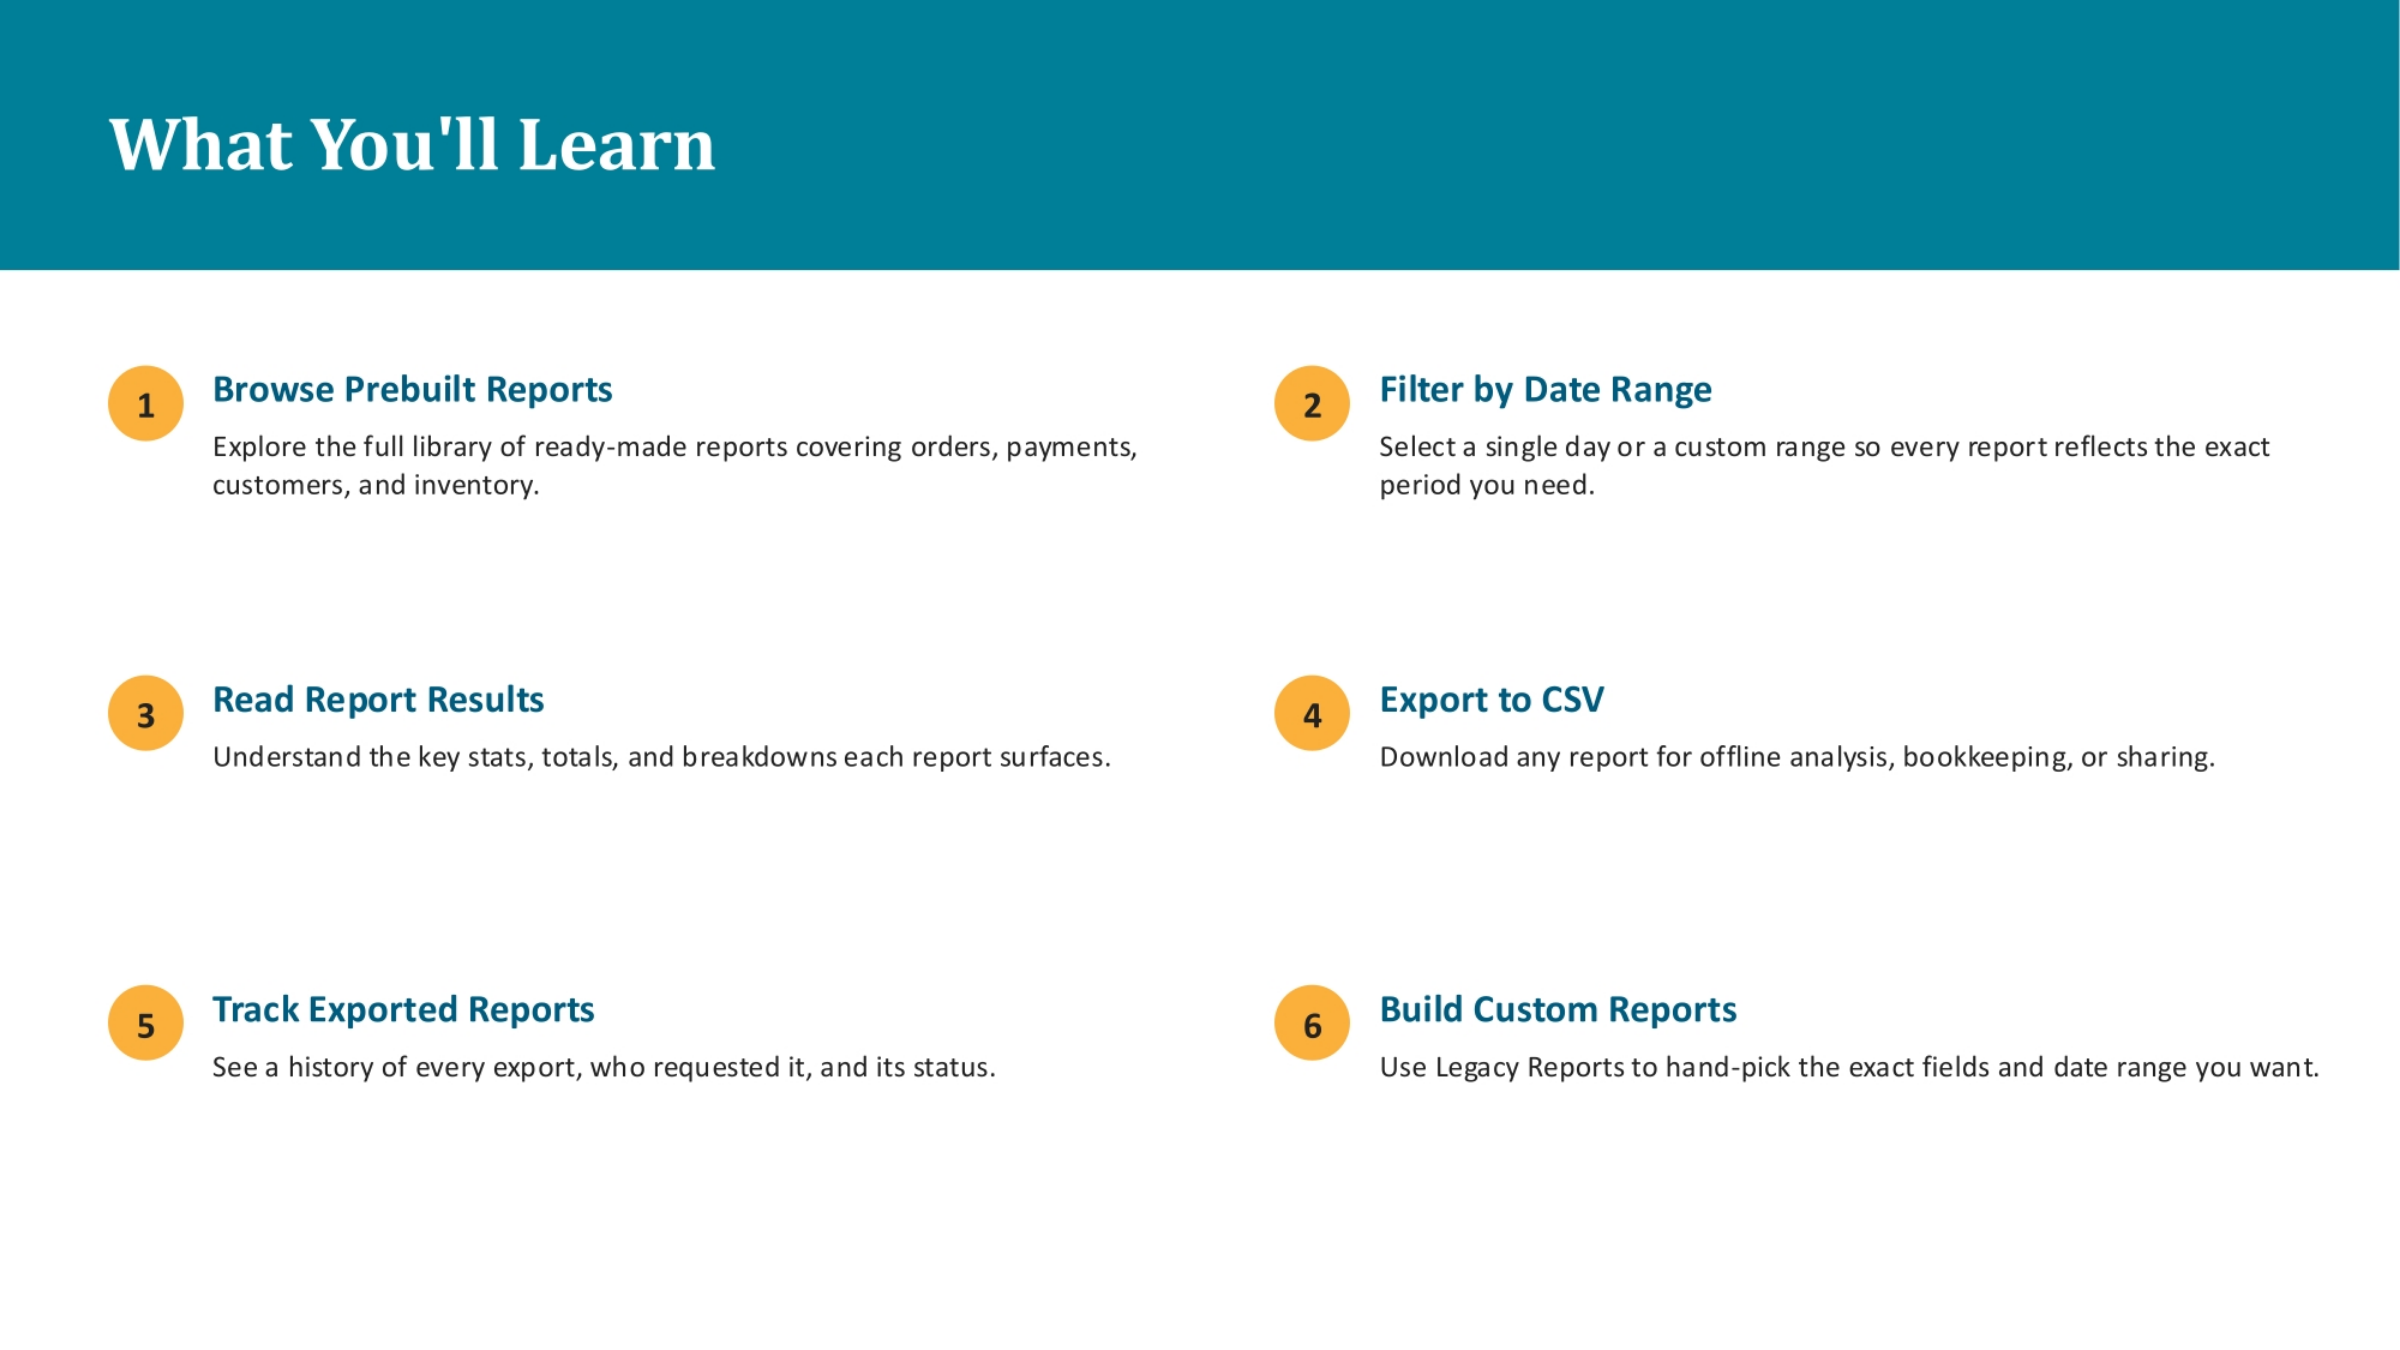
Today, we'll cover several key areas to enhance your reporting skills. First, you'll learn how to browse prebuilt reports, exploring the full library of ready-made options for orders, payments, customers, and inventory. We'll then demonstrate how to filter reports by date range, allowing you to select specific periods for analysis. You'll also understand how to read report results, interpreting key statistics and breakdowns. Finally, we'll show you how to export reports to CSV, track your exported files, and build custom reports using Legacy Reports to hand-pick specific fields and date ranges.
2. Accessing the Reports Hub
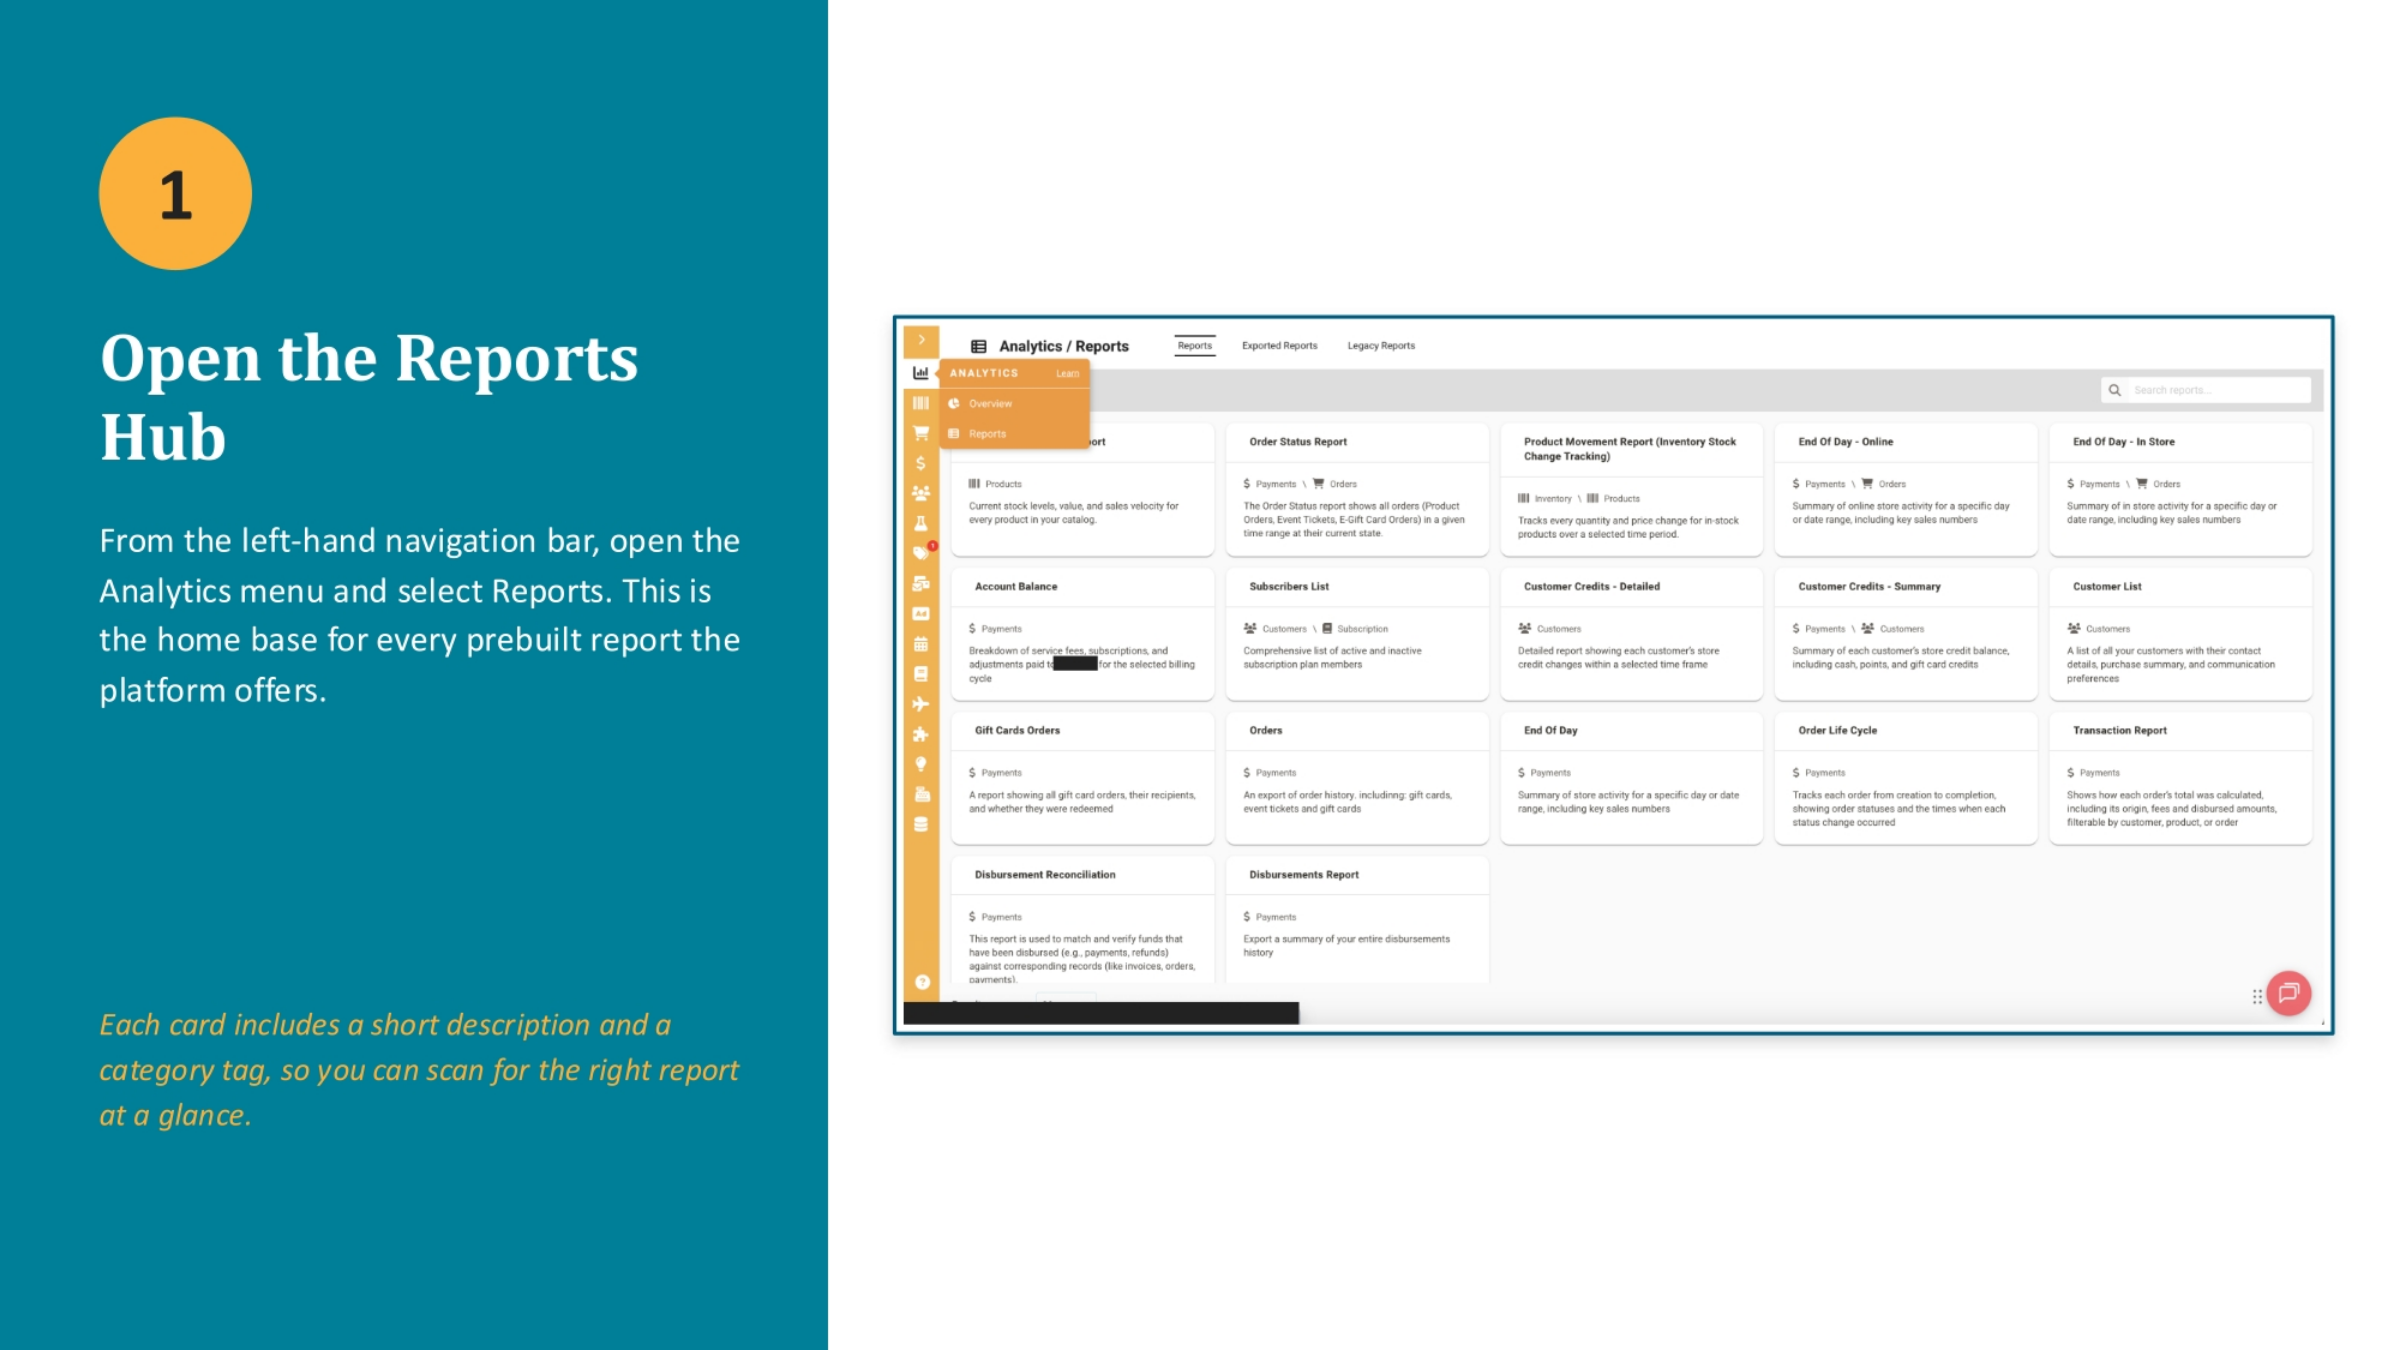
To begin, navigate to the Reports Hub, which serves as the central location for all prebuilt reports. From the left-hand navigation bar, simply open the Analytics menu and select "Reports." This hub provides a comprehensive overview, with each report presented as a card. Each card includes a short description and a category tag, making it easy to quickly scan and identify the right report for your needs.
3. Exploring the Report Library
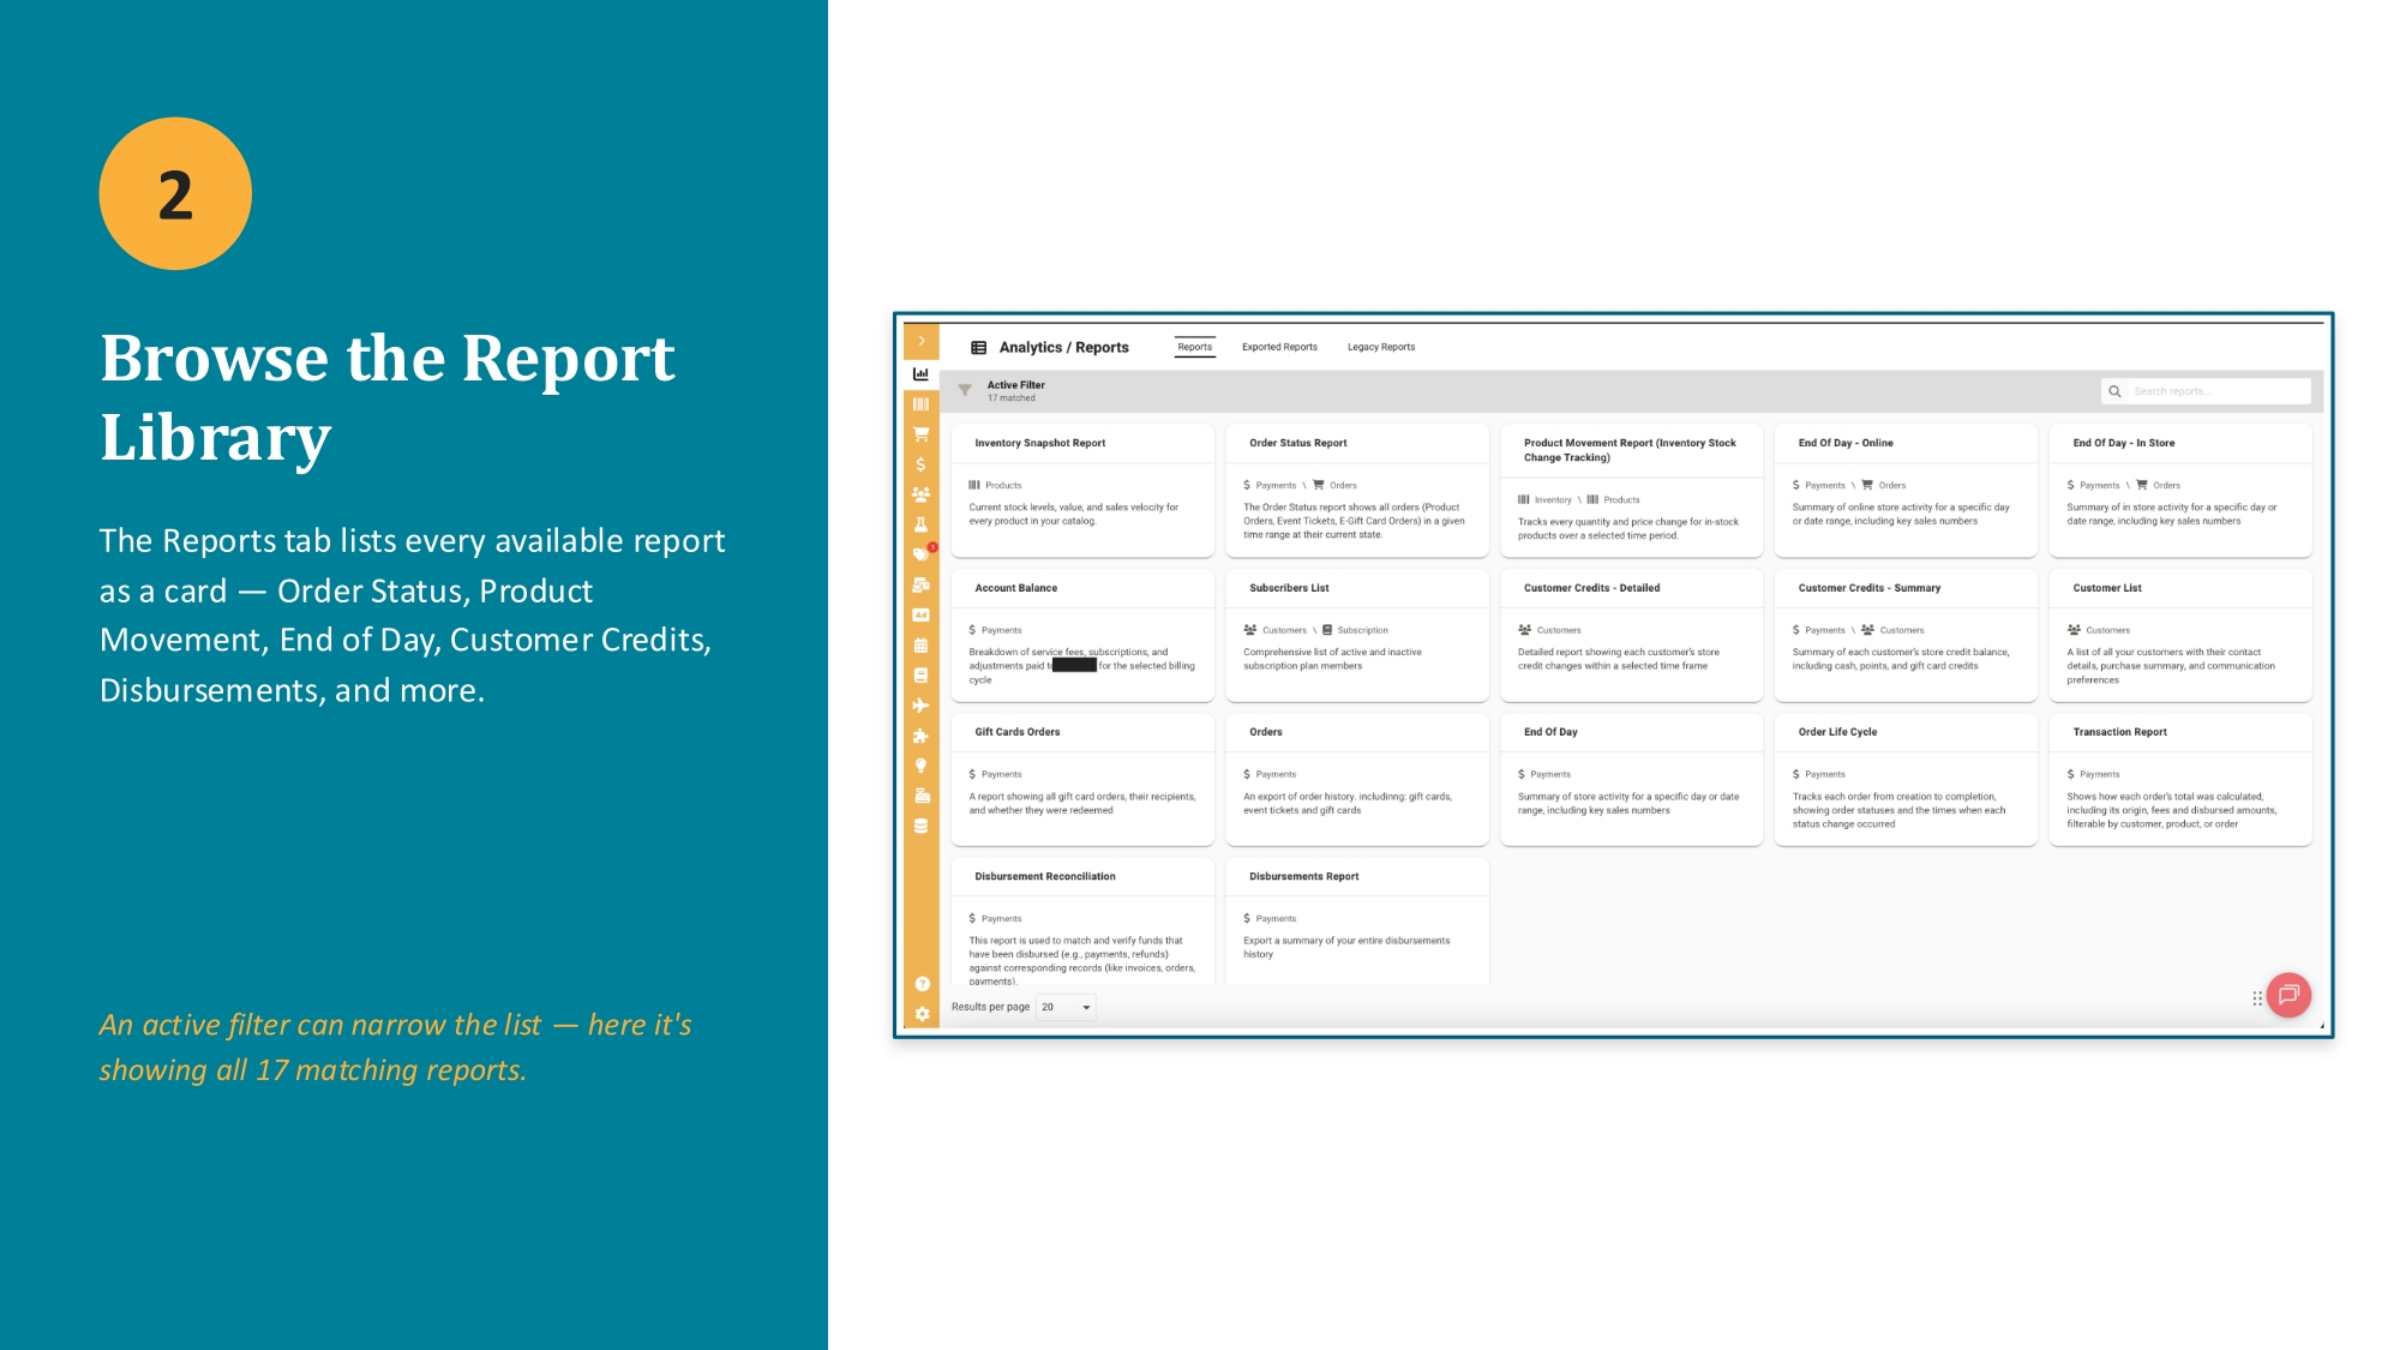
The Reports tab displays every available report as an individual card, offering a wide array of options. You'll find reports covering critical areas such as Order Status, Product Movement, End of Day summaries, Customer Credits, and Disbursements. To streamline your search, an active filter can be applied, narrowing down the list to show only matching reports. This feature helps you efficiently locate the specific data you need from the extensive library.
4. Selecting a Report Date Range
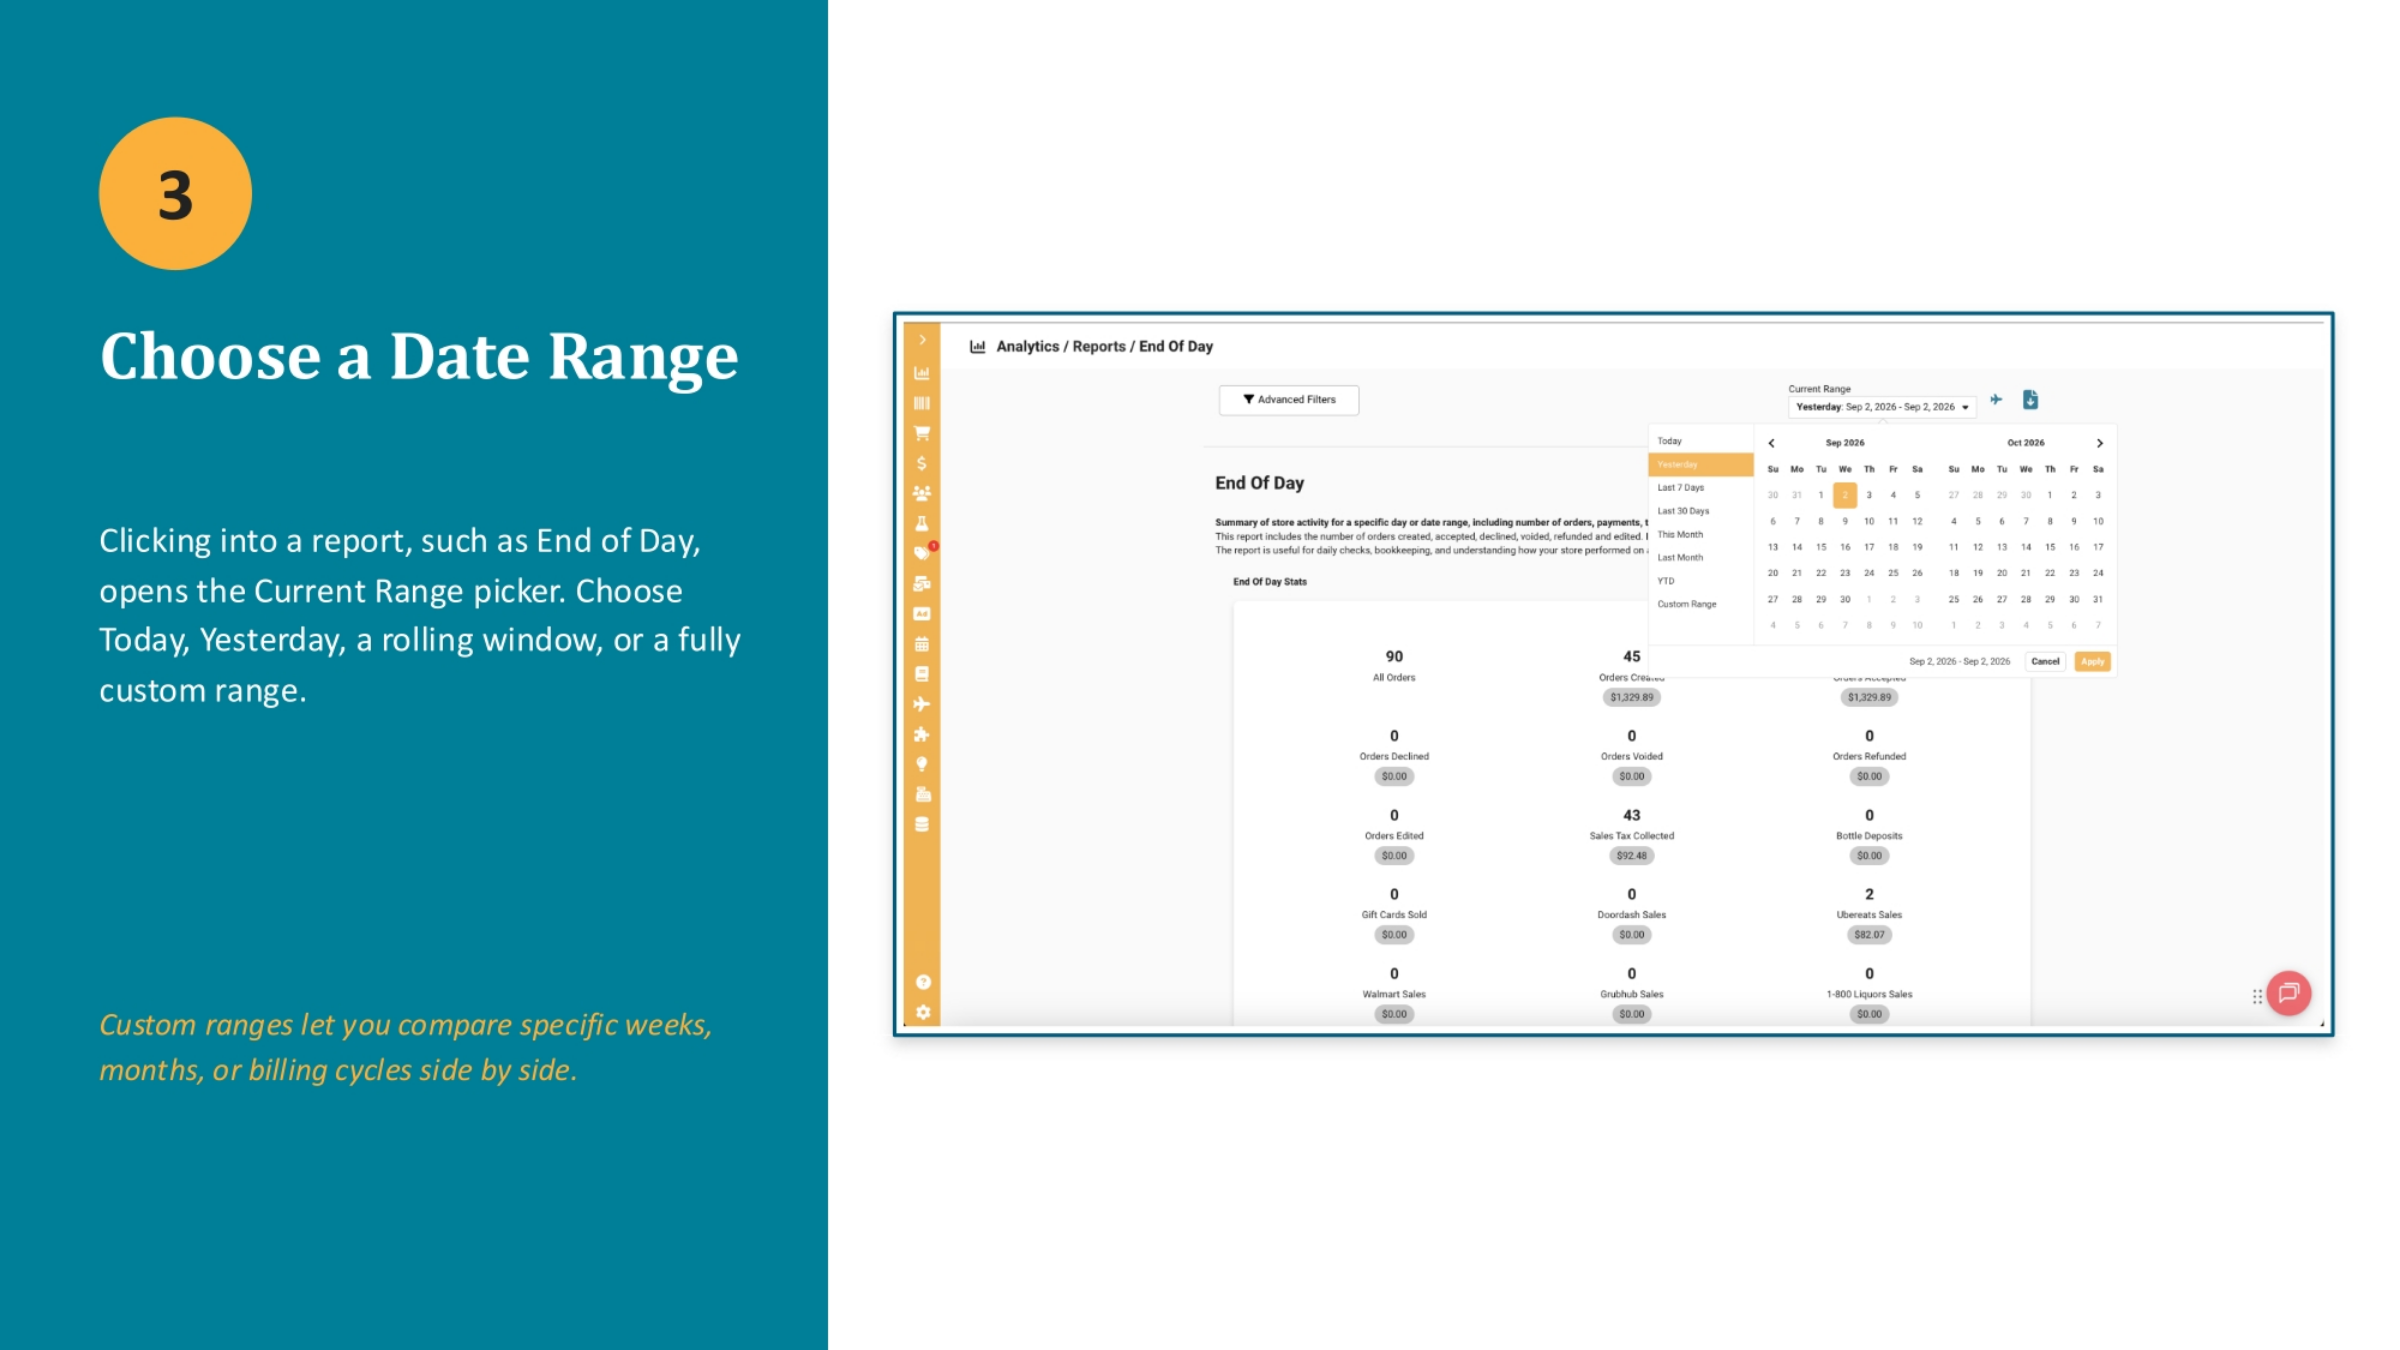
Once you've selected a report, such as the "End of Day" report, you'll need to choose a date range for your data. Clicking into the report opens the Current Range picker, where you can select "Today," "Yesterday," a rolling window like the last 7 or 30 days, or a fully custom range. Custom ranges are particularly useful for comparing specific weeks, months, or even entire billing cycles side by side, providing flexible analysis options.
5. Understanding Key Report Metrics
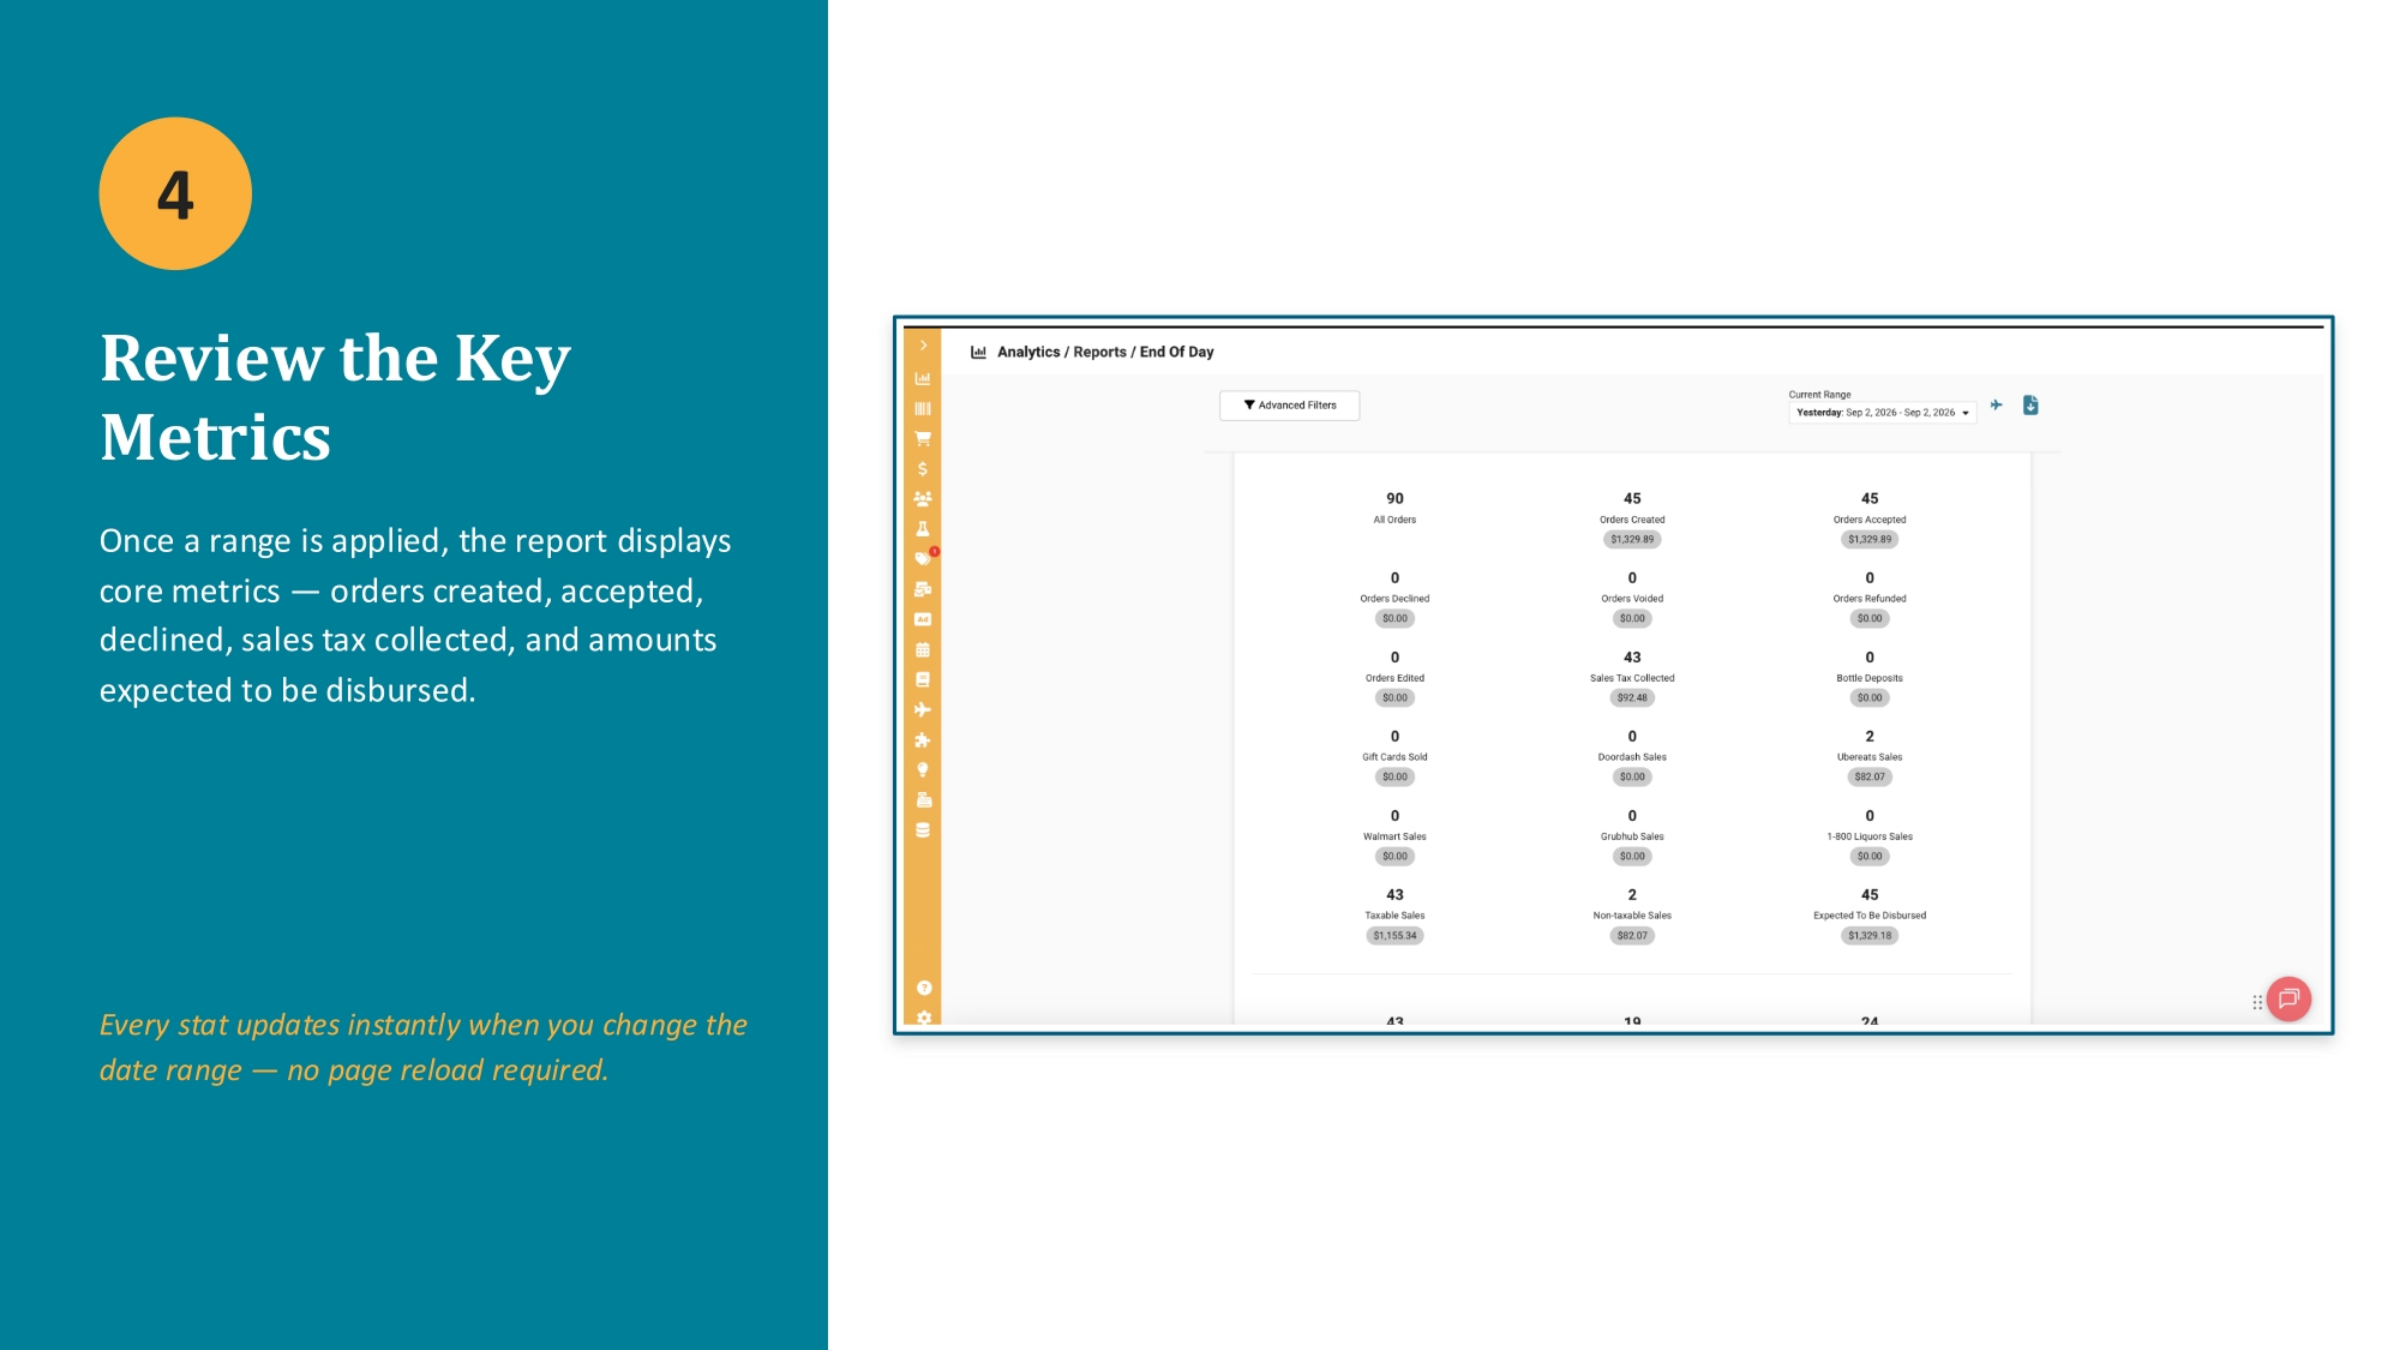
After applying your desired date range, the report will display its core metrics. These include essential data points such as the total number of orders created, accepted, declined, and voided. You'll also see figures for sales tax collected and the amounts expected to be disbursed. A key advantage of this system is that every statistic updates instantly when you change the date range, eliminating the need for a page reload and ensuring real-time data accuracy.
6. Detailed Financial Breakdowns
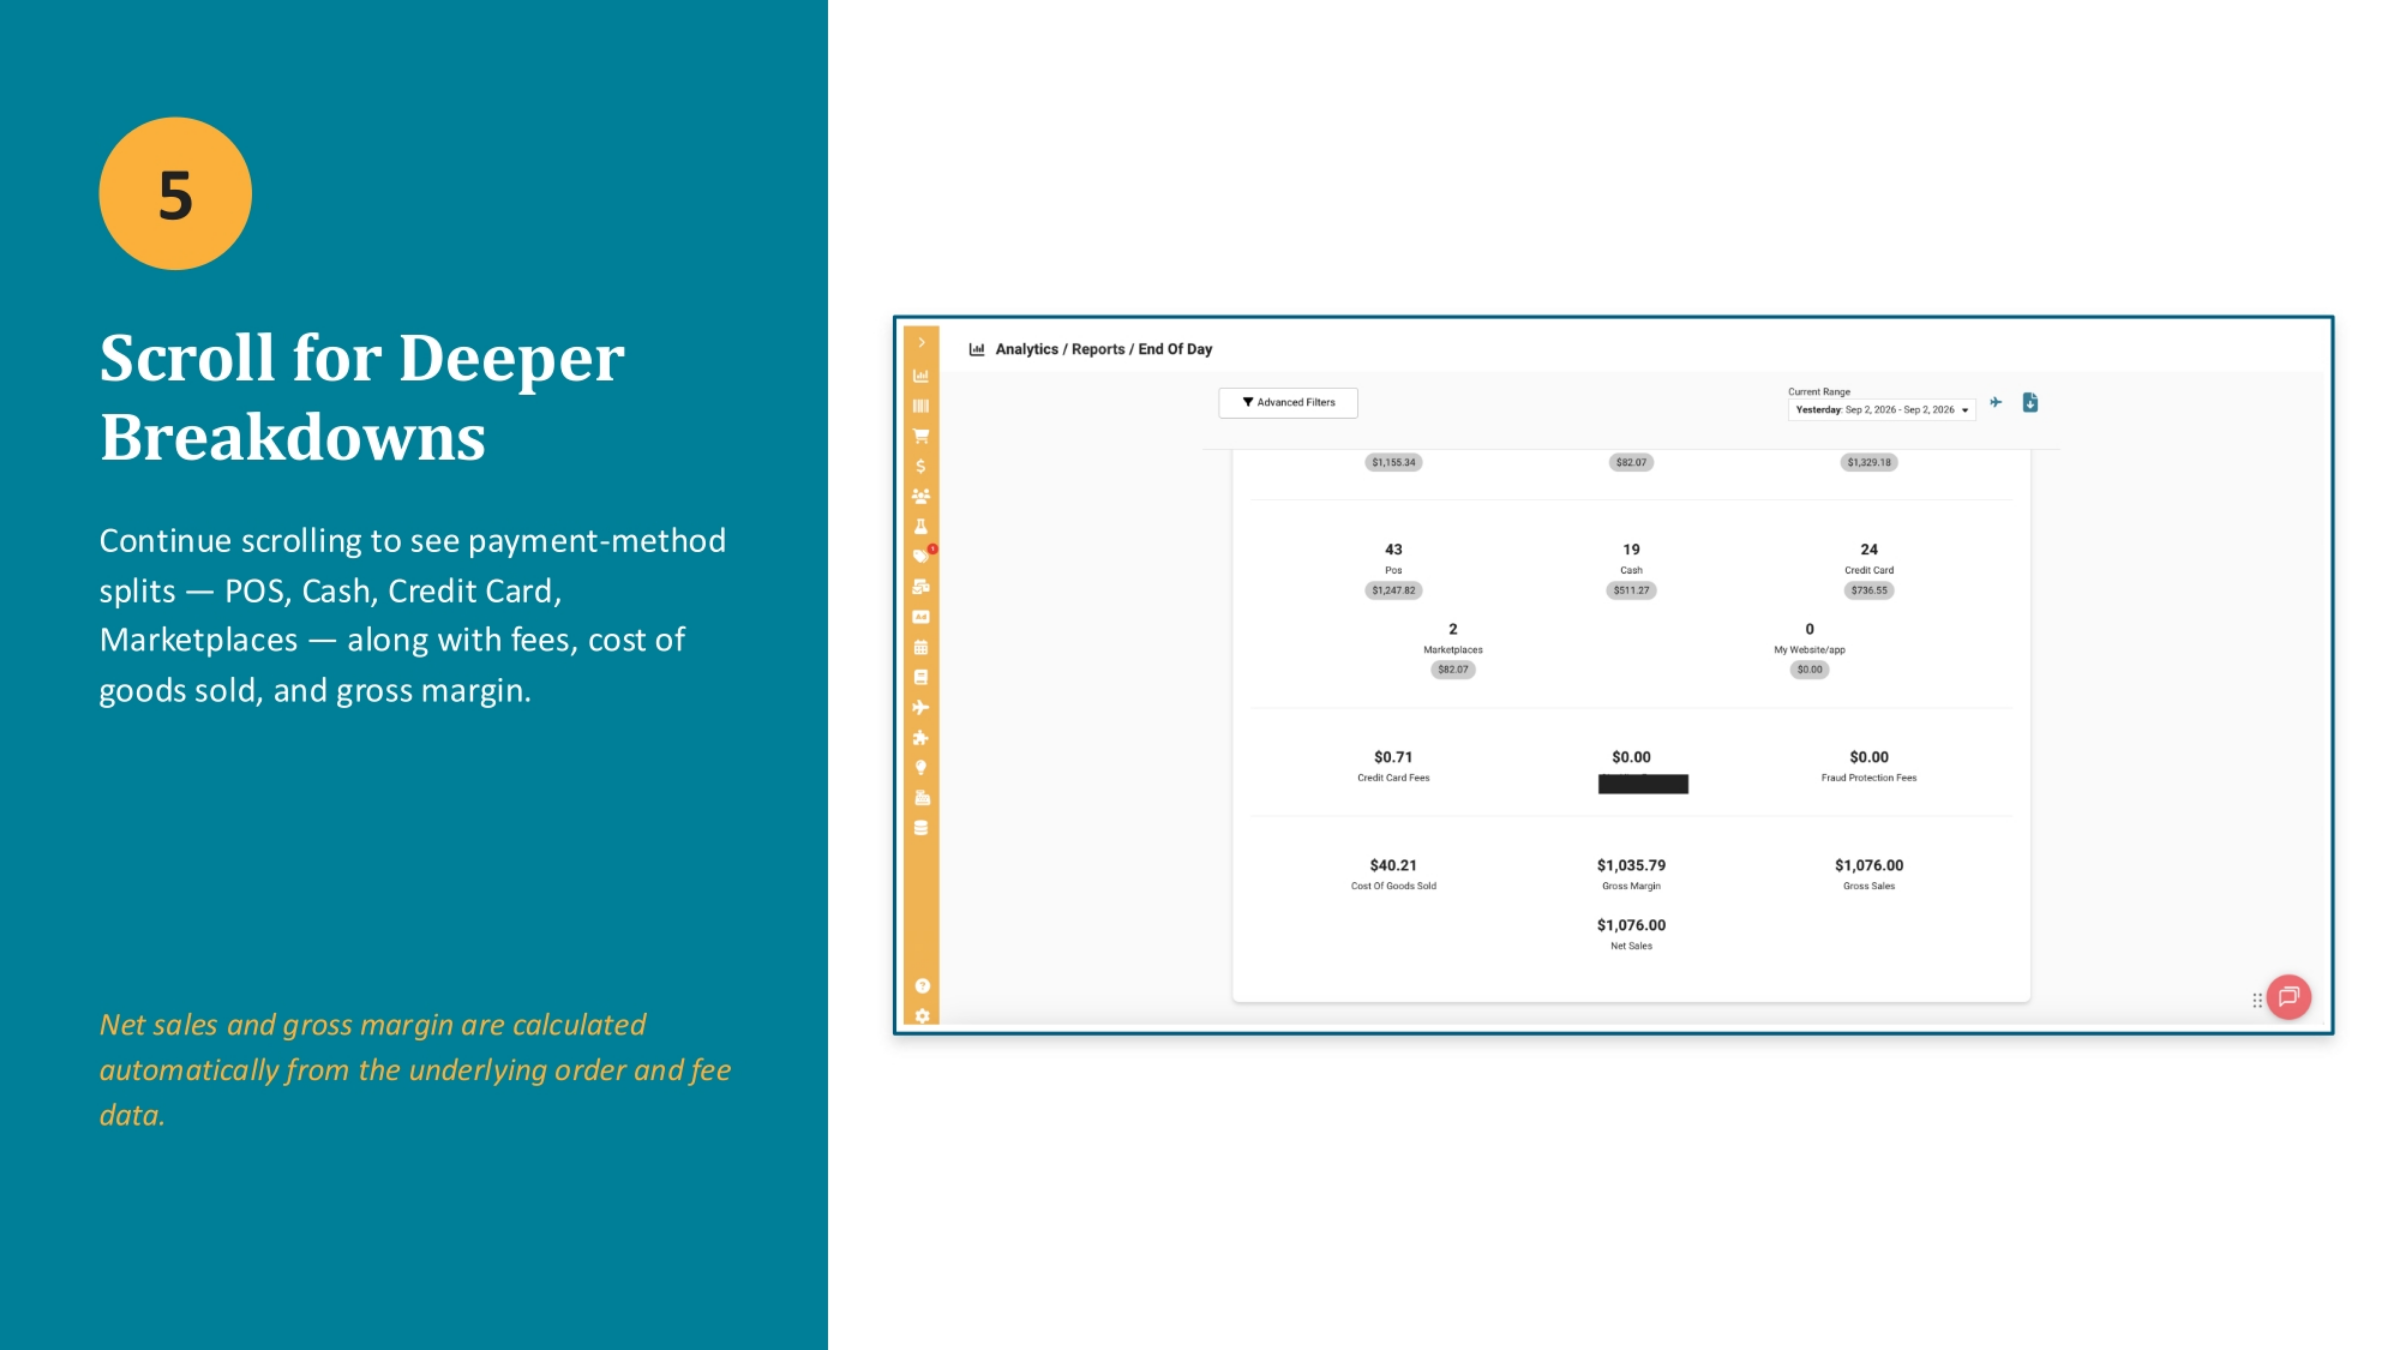
To gain a more granular understanding of your financial performance, continue scrolling down the report. Here, you'll find deeper breakdowns, including payment-method splits for Point of Sale, Cash, Credit Card, and various Marketplaces. Additionally, the report details associated fees, the cost of goods sold, and your gross margin. Net sales and gross margin are automatically calculated from the underlying order and fee data, providing comprehensive financial insights without manual computation.
7. Exporting Reports to CSV
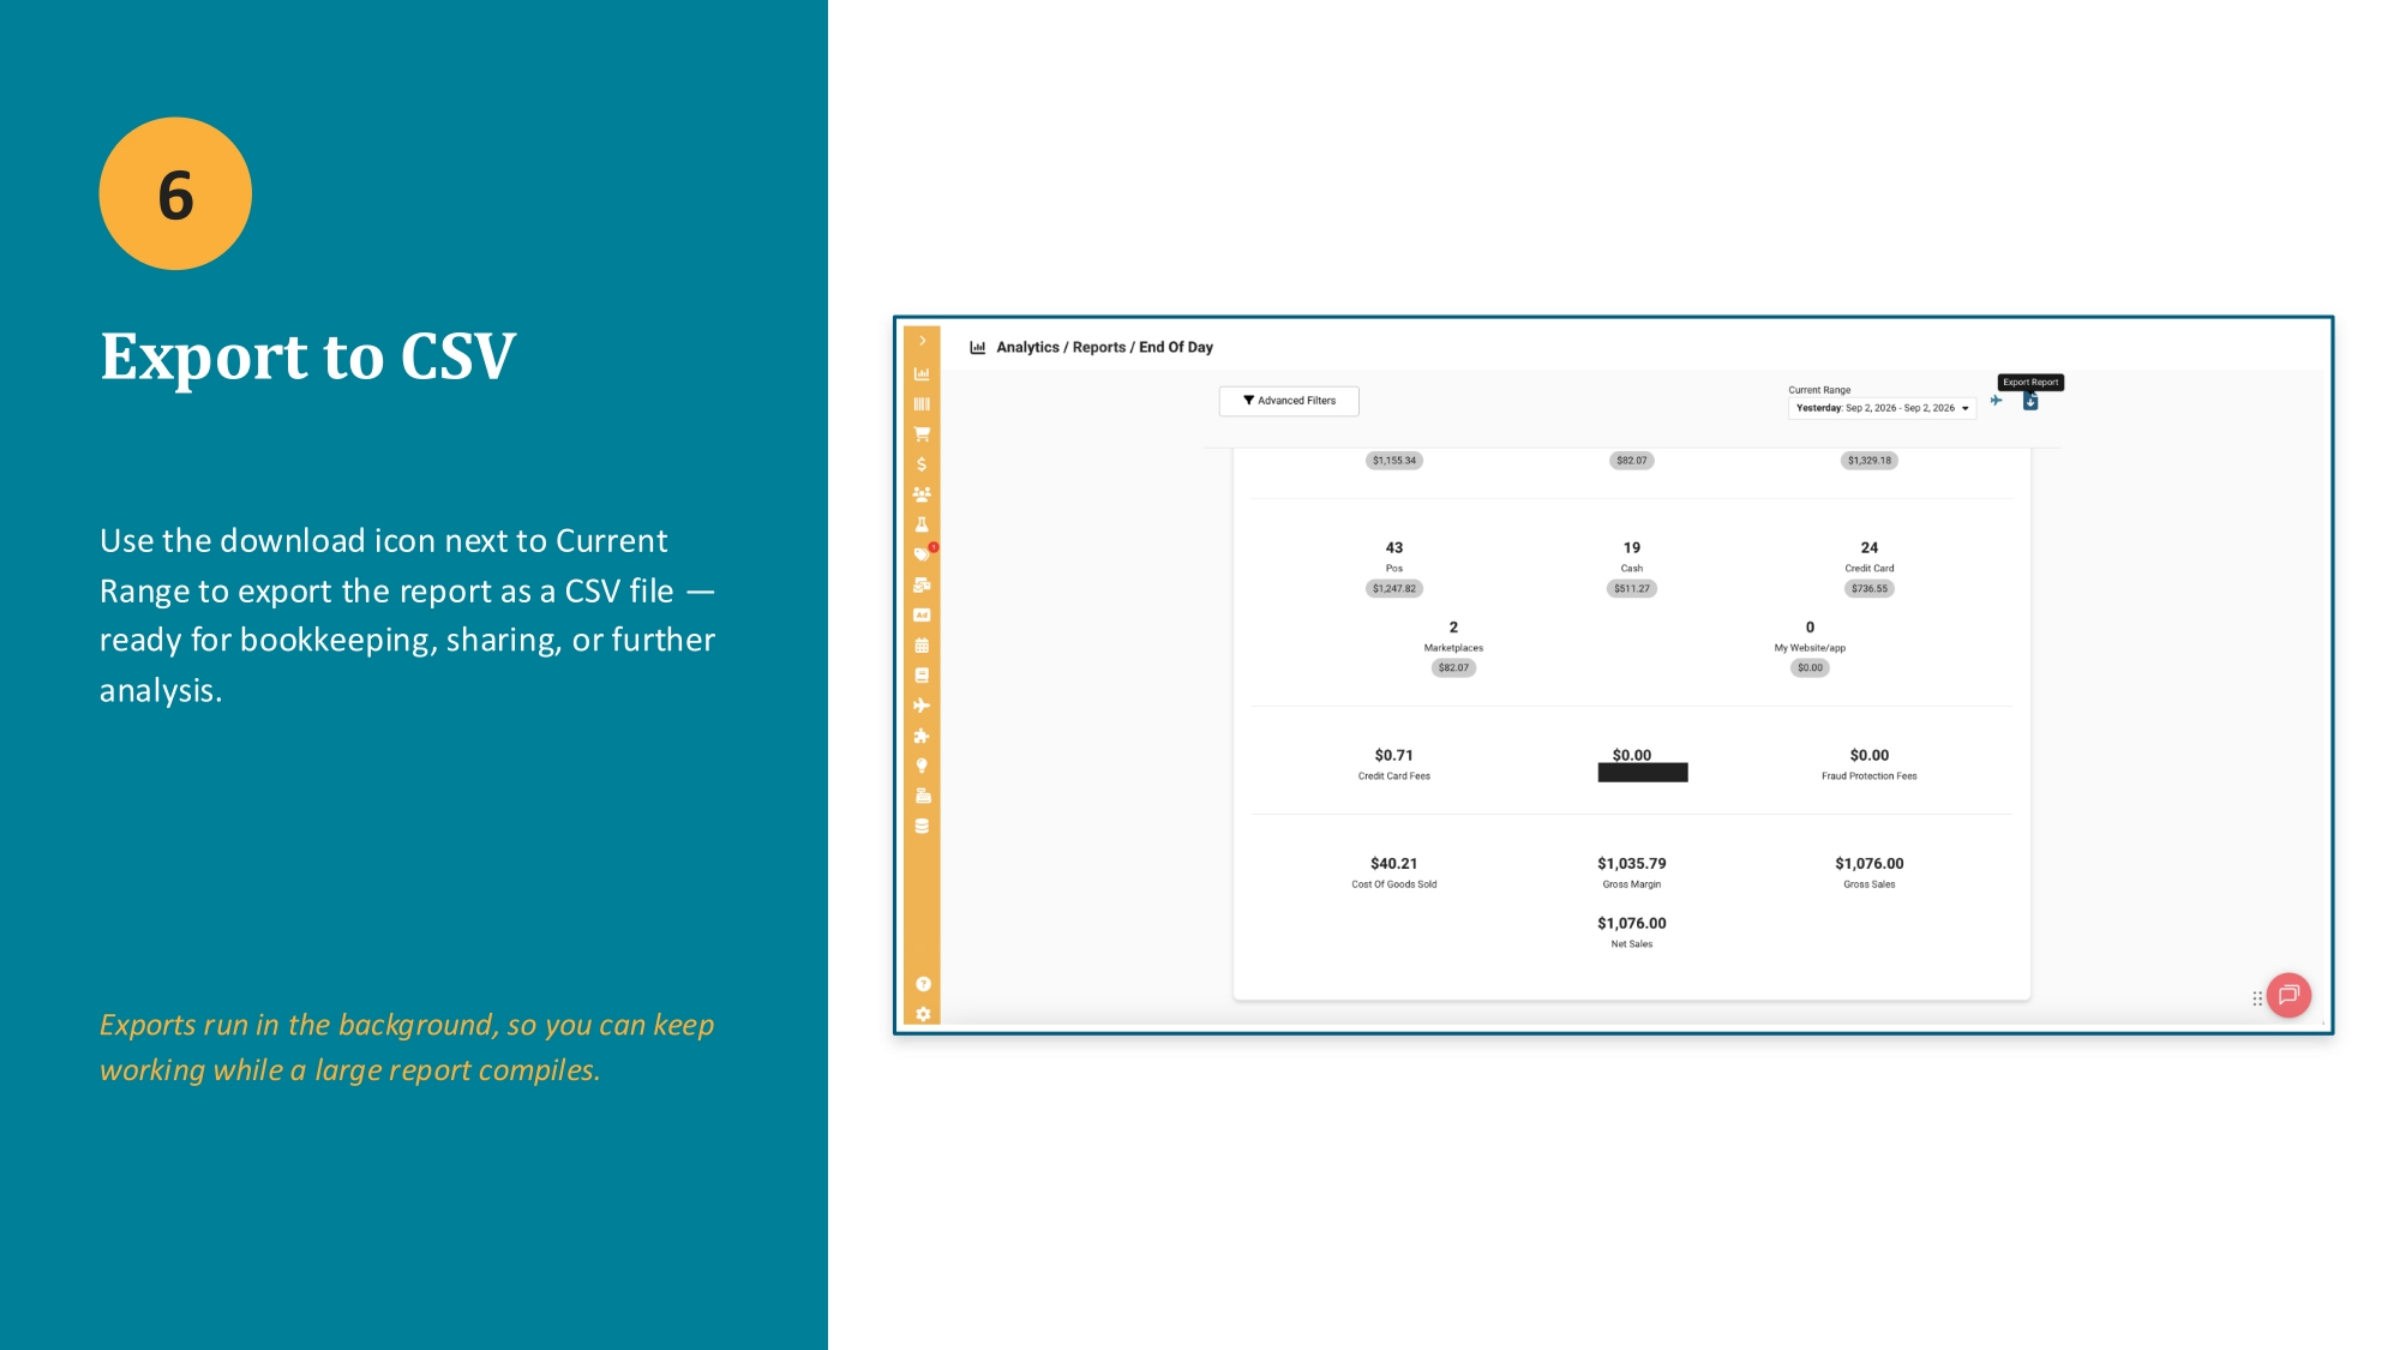
For offline analysis, bookkeeping, or sharing with others, you can easily export any report to a CSV file. Simply use the download icon located next to the "Current Range" selection. This feature allows you to compile large reports efficiently. Exports run in the background, meaning you can continue working within the platform while your report is being processed, ensuring uninterrupted workflow.
8. Monitoring Export History
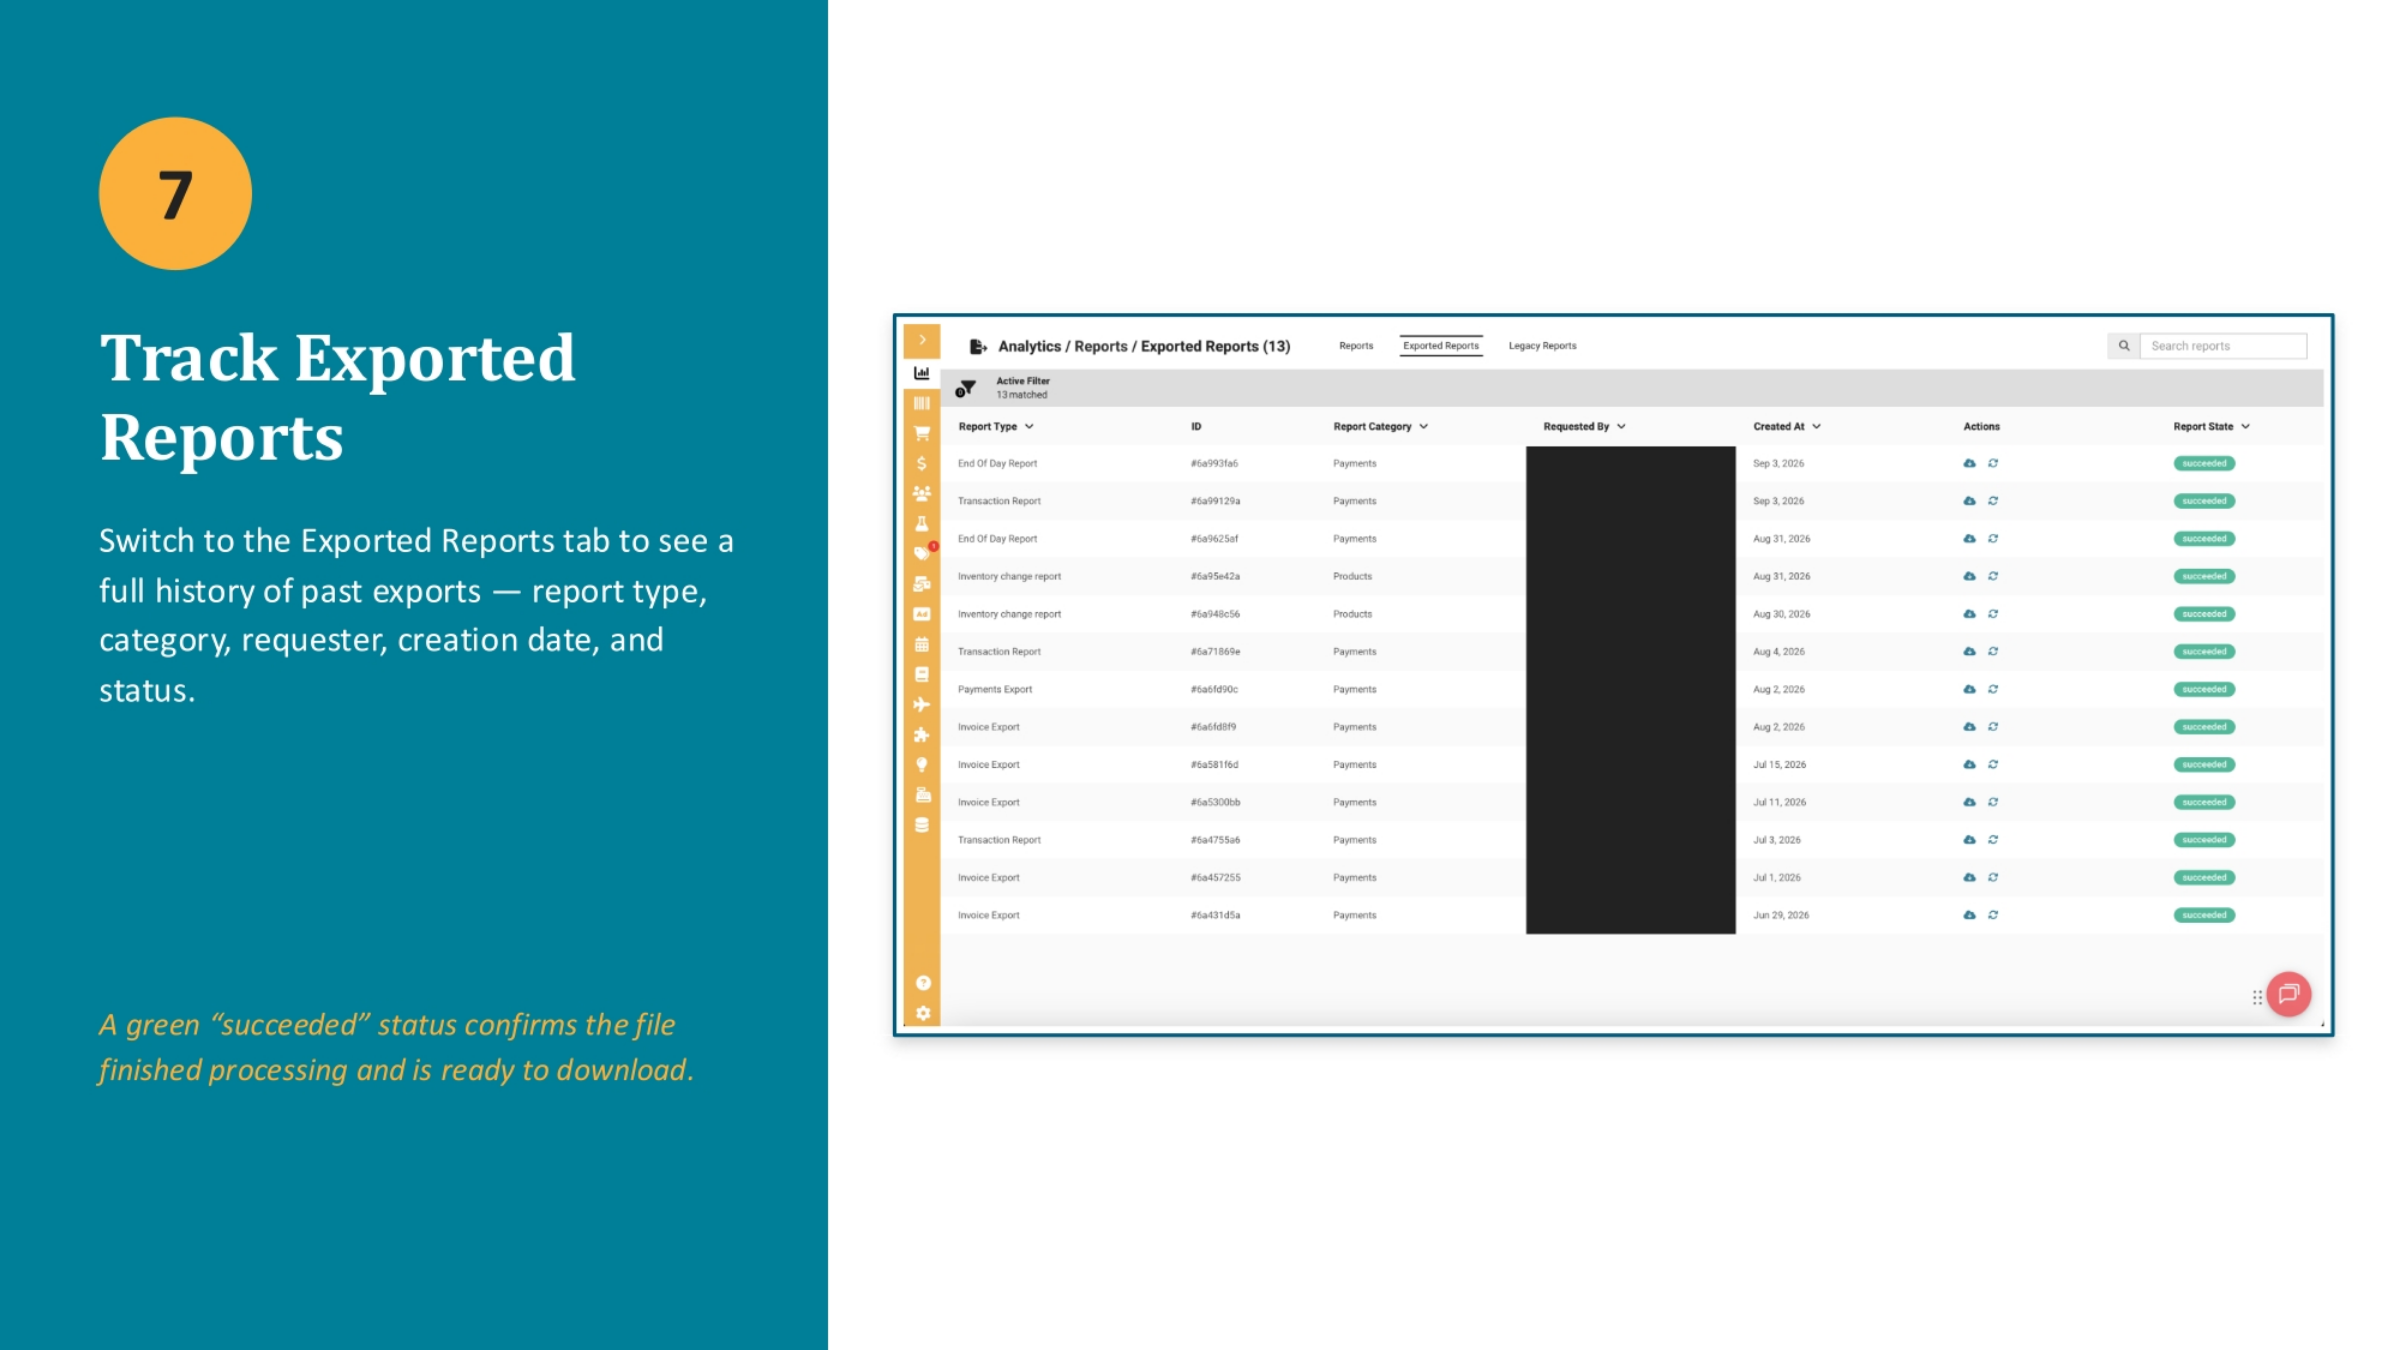
To keep track of all your past data exports, switch to the "Exported Reports" tab. This section provides a comprehensive history, detailing the report type, its category, who requested it, the creation date, and its current status. A green "succeeded" status confirms that the file has finished processing and is ready for you to download, ensuring you always know the availability of your requested data.
9. Creating Custom Reports with Legacy Reports
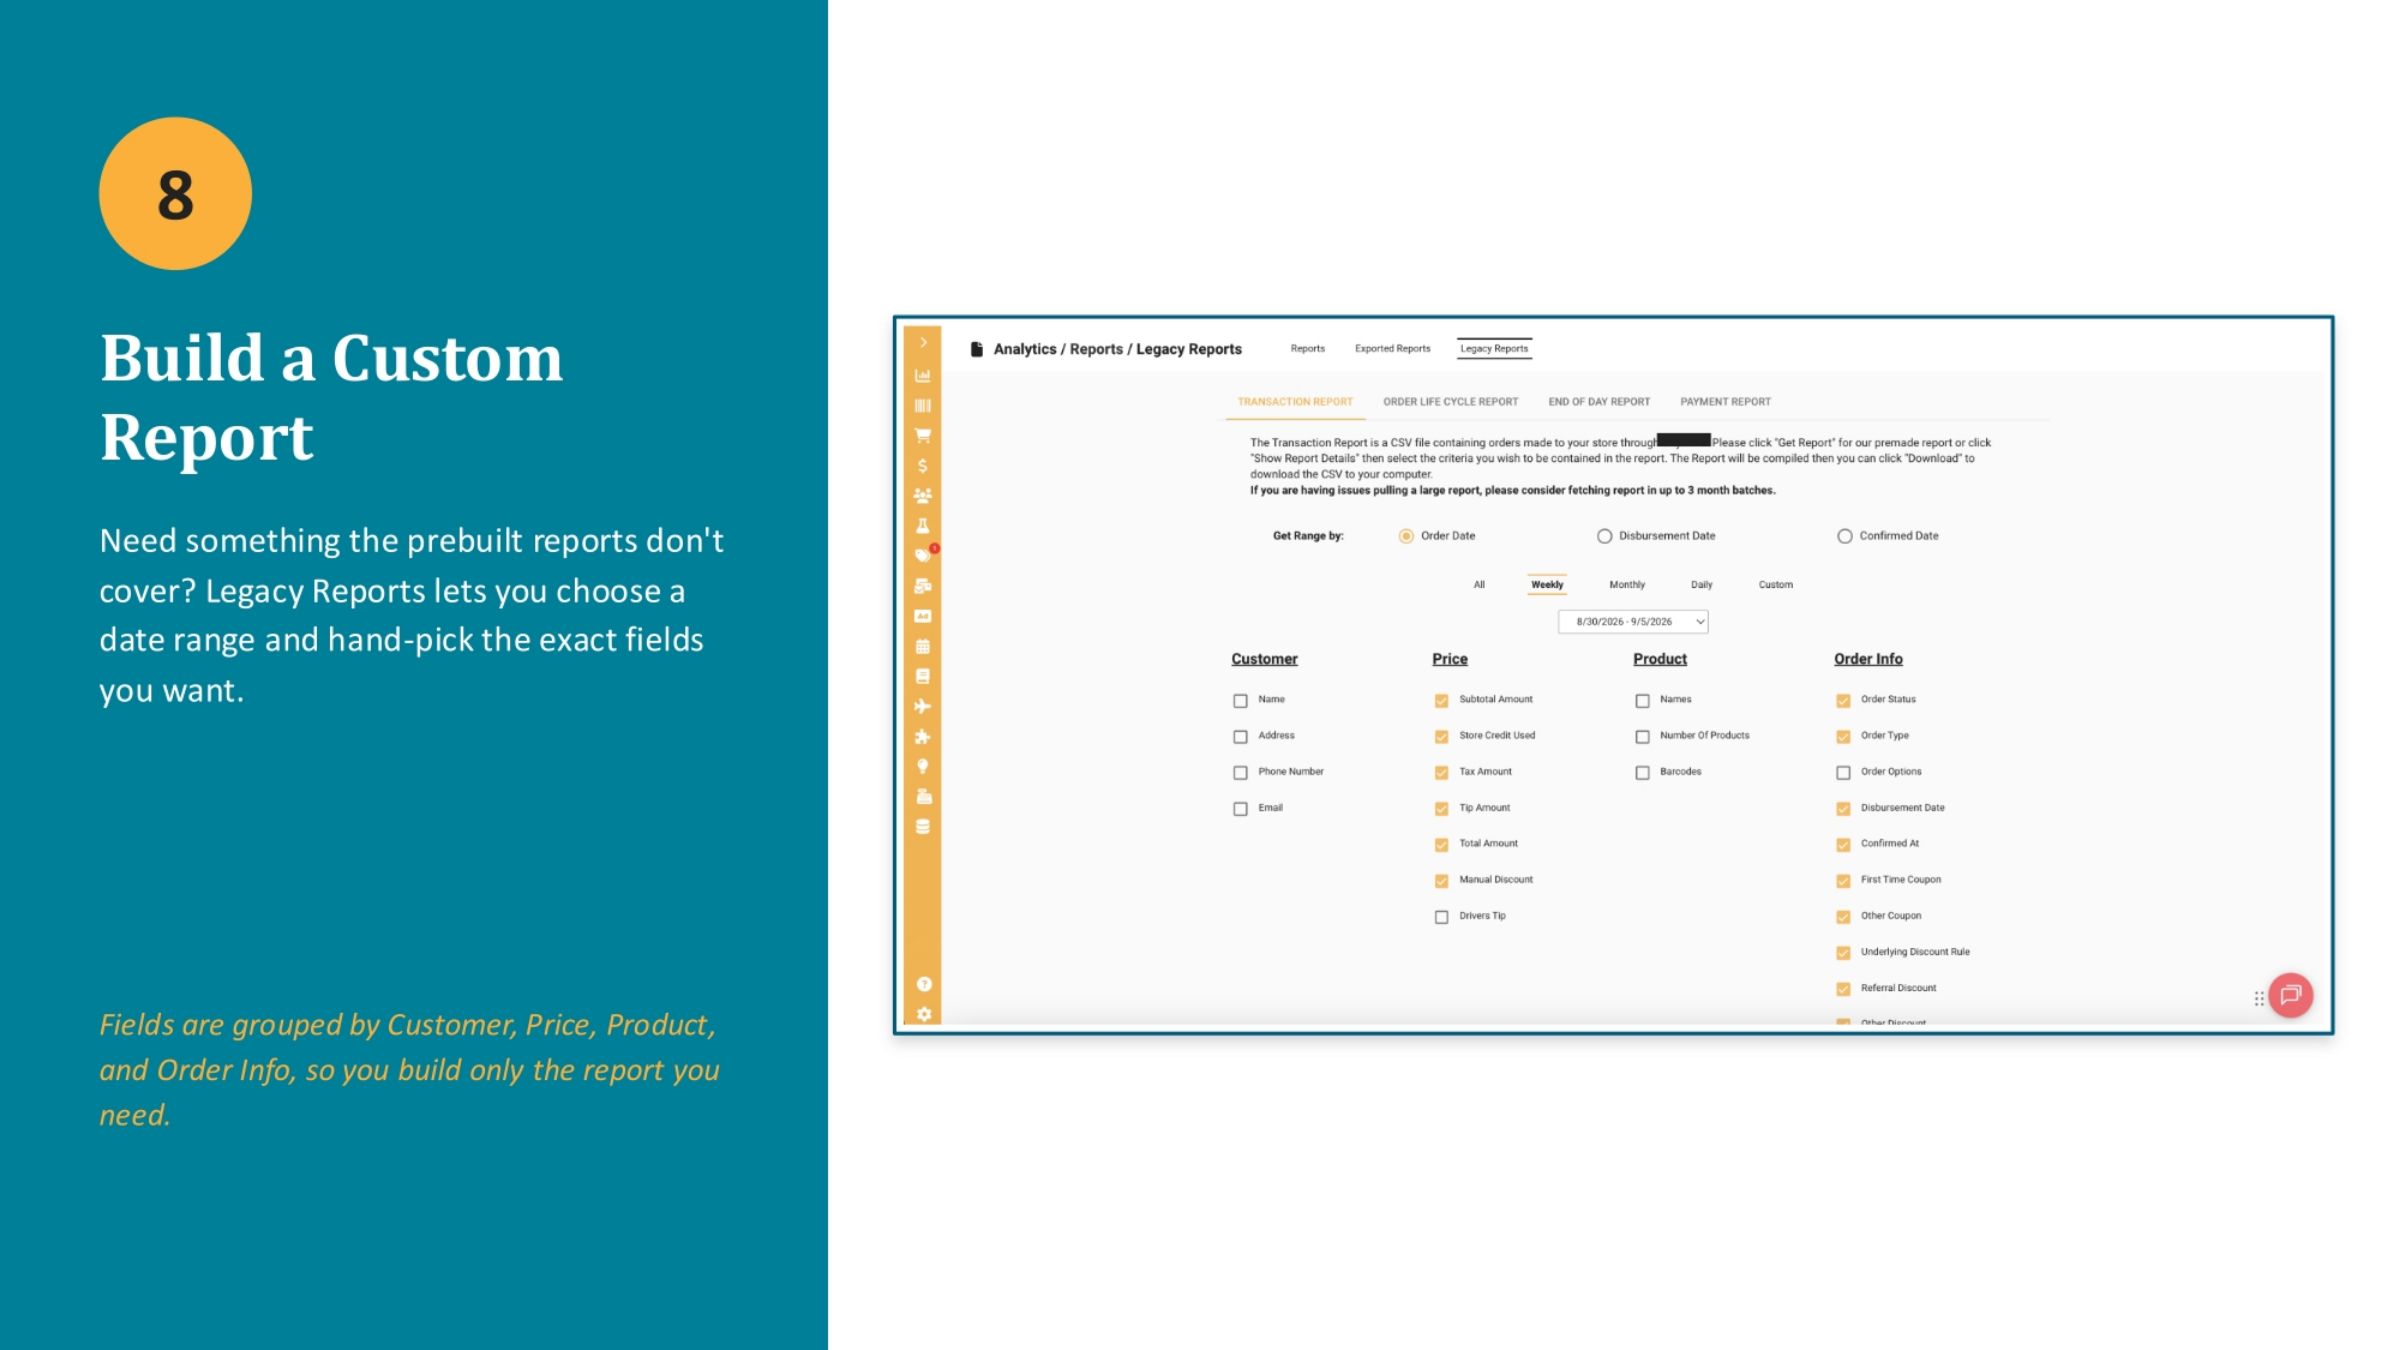
When the prebuilt reports don't quite meet your specific needs, "Legacy Reports" offers full customization. This powerful feature allows you to choose a precise date range and hand-pick the exact fields you want to include in your report. Fields are conveniently grouped by categories such as Customer, Price, Product, and Order Info, enabling you to build highly tailored reports that contain only the data most relevant to your analysis.
10. Key Takeaways
To recap, reports are found under Analytics, organized as browsable cards, and support flexible date-range filtering. Results can be exported to CSV, and the Exported Reports tab tracks past exports. Finally, Legacy Reports provides full control for building custom field sets on demand.