---
title: Inventory Insights
description: Inventory Insights is a dashboard view that gives merchants visibility into inventory performance, reorder timing, and pricing position relative to nearby stores. It includes Market Intelligence, an industry-wide pricing and product data layer that surfaces both in the Inventory Insights view and the Product Import flow.
---
[Skip to content](https://support.cityhive.net/inventory-insights#main-content)
[Contact Us](https://support.cityhive.net/kb-tickets/new?hsLang=en) [Customer portal](https://support.cityhive.net/tickets-view?hsLang=en)
![City Hive Logo-2.png\]](https://support.cityhive.net/hs-fs/hubfs/City%20Hive%20Logo-2.png?width=62&height=60&name=City%20Hive%20Logo-2.png)
Open main navigation
Close main navigation
- [Contact Us](https://support.cityhive.net/kb-tickets/new)
- [Customer portal](https://support.cityhive.net/tickets-view)
We're here to help!
- There are no suggestions because the search field is empty.
1. [City Hive Support](https://support.cityhive.net/?hsLang=en)
2. [Inventory Management](https://support.cityhive.net/inventory-management?hsLang=en)
3. [Standard Inventory Management](https://support.cityhive.net/inventory-management?hsLang=en#standard-inventory-management)
# Inventory Insights
## Use Inventory Insights to monitor inventory performance, plan reorders, and see how your pricing stacks up against nearby stores. Learn how to use this feature below!
1. [**Begin on the Inventory section**](https://merchants.cityhive.net/#!/ffffff/inventory) of the dashboard
2. **Select Inventory Insights
**
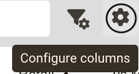
3. **Click** the **settings wheel on the top left** to open **Configure Columns**
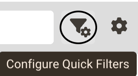
4. To add product groups to your filter**,** click on **Configure Quick Filters**
5. **Drag and drop** the columns to rearrange their order
6. **Click the "X"** next to any column to remove it, or **drag it back** under Column Order to reactivate it
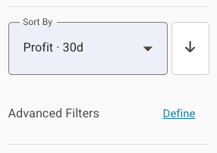
7. From here, you can utilize the **filters** or the **advanced filters on the left** to view and sort:
**On Hand** — current physical inventory count
**Days Supply** — how many days current stock will last based on real sales velocity, accounting for day-of-week patterns
**Sold (30d)** — units sold in the last 30 days
**Trend** — a 30-day trend line showing sales movement over time
**Movement Tags** — automatic status labels: Breakout, Rising, Stable, Declining, Dead
**Cost** — what the merchant paid for the item
**Retail** — current selling price
**Market** — how the merchant's price compares to nearby stores (see Understanding vs Market below)
**Margin %** — calculated margin
**Inventory Value** — total dollar value of current stock
**Revenue (30d)** — revenue from this item in the last 30 days
**Profit (30d)** — profit from this item in the last 30 days
**Status** — overall stock status: In Stock, Low Stock, or Out of Stock
For a breakdown on how to utilize the parameters when using the Advanced Filter, **[view our article here](https://support.cityhive.net/how-to-utilize-parameters?hsLang=en)**.
#### [How Inventory Insights Works](https://support.cityhive.net/inventory-insights#howinventoryinsightswork)
**Product Import**
When importing a new product, key fields are automatically filled in. Common product size is pulled from industry data, including vintage when applicable. Cost and price are pre-filled using the median price from stores in the same city, or state-level data if fewer than 5 city stores carry the item. If the item already exists in your inventory, cost and price pull from the existing record — market data is still shown for reference. Sale price can be set at the time of import, and size entry is structured to keep data consistent across your catalog.
**Troubleshooting Data Issues**
Insights are generated from price, quantity, and cost data. Occasional mismatches can occur — for example, a cost value recorded for a case being compared to the price of a single unit. If data looks incorrect, submit an integration ticket to resolve it. If no Market value appears for an item, there may not be enough nearby store data to generate a comparison — this is expected for very unique or specialty items.
Updates automatically every 24 hours, or immediately when an item's price, cost, or quantity changes.
- [Get Set Up](https://support.cityhive.net/get-set-up?hsLang=en#main-content)
- [Create Your Merchant Account](https://support.cityhive.net/get-set-up?hsLang=en#create-your-merchant-account)
- [Configure Your Settings](https://support.cityhive.net/get-set-up?hsLang=en#configure-your-settings)
- [Launch Your Website and App](https://support.cityhive.net/get-set-up?hsLang=en#launch-your-website-and-app)
- [Marketplace Integrations](https://support.cityhive.net/get-set-up?hsLang=en#marketplace-integrations)
- [Orders - Need Help?](https://support.cityhive.net/orders-need-help?hsLang=en#main-content)
- [Shipping](https://support.cityhive.net/orders-need-help?hsLang=en#shipping)
- [Delivery Optimization](https://support.cityhive.net/orders-need-help?hsLang=en#delivery-optimization)
- [Digital Gift Cards](https://support.cityhive.net/orders-need-help?hsLang=en#digital-gift-cards)
- [Inventory Management](https://support.cityhive.net/inventory-management?hsLang=en#main-content)
- [City Hive POS](https://support.cityhive.net/inventory-management?hsLang=en#city-hive-pos)
- [Set Up and Sync](https://support.cityhive.net/inventory-management?hsLang=en#set-up-and-sync)
- [Update Product Information](https://support.cityhive.net/inventory-management?hsLang=en#update-product-information)
- [Standard Inventory Management](https://support.cityhive.net/inventory-management?hsLang=en#standard-inventory-management)
- [Customize Your Website & App](https://support.cityhive.net/customize-your-website-app?hsLang=en#main-content)
- [Creating and Editing Pages](https://support.cityhive.net/customize-your-website-app?hsLang=en#creating-and-editing-pages)
- [Graphics & Design](https://support.cityhive.net/customize-your-website-app?hsLang=en#graphics-design)
- [Content Organization](https://support.cityhive.net/customize-your-website-app?hsLang=en#content-organization)
- [Promotions](https://support.cityhive.net/promotions?hsLang=en#main-content)
- [Promotions](https://support.cityhive.net/promotions?hsLang=en#promotions)
- [Wine Clubs](https://support.cityhive.net/wine-clubs?hsLang=en#main-content)
- [Wine Club](https://support.cityhive.net/wine-clubs?hsLang=en#wine-club)
- [Marketing & Customer Engagement](https://support.cityhive.net/marketing-customer-engagement?hsLang=en#main-content)
- [Email, Push & SMS Marketing](https://support.cityhive.net/marketing-customer-engagement?hsLang=en#email-push-sms-marketing)
- [Customer Acquisition & Management](https://support.cityhive.net/marketing-customer-engagement?hsLang=en#customer-acquisition-management)
- [Autopilot](https://support.cityhive.net/autopilot?hsLang=en)
- [Events](https://support.cityhive.net/events?hsLang=en)
- [Overview & Reports](https://support.cityhive.net/overview-reports?hsLang=en)
- [Payments & Billing](https://support.cityhive.net/payments-billing?hsLang=en#main-content)
- [Transactions](https://support.cityhive.net/payments-billing?hsLang=en#transactions)
- [Payments](https://support.cityhive.net/payments-billing?hsLang=en#payments)
- [Disbursements](https://support.cityhive.net/payments-billing?hsLang=en#disbursements)
- [Chargebacks](https://support.cityhive.net/payments-billing?hsLang=en#chargebacks)
- [Ads & Analytics](https://support.cityhive.net/ads-analytics?hsLang=en#main-content)
- [Analytics](https://support.cityhive.net/ads-analytics?hsLang=en#analytics)
- [Ads](https://support.cityhive.net/ads-analytics?hsLang=en#ads)
- [FAQs](https://support.cityhive.net/faqs?hsLang=en)
[](http://cityhive.net)
City Hive Help Center
Copyright © 2026, City Hive, Inc.